 By Ed Ezzie (Grade 3/4 Teacher, Australia)
To teach graphing this week I used the stunning text Uno’s Garden (2006) by Graeme Base. The text basically shows how as the number of people and buildings increase in Uno’s garden the number of plants and animals decrease. However, this story does much more than show data! It is a wonderful resource to draw from to teach using the cognitive tools of Imaginative Education. I have been using this text for a couple of years to teach graphing in Math to my Grade 3/4 students. Usually we read the story and then my students graph the data. This time I wanted to increase my students’ engagement by using more cognitive tools.
My first step in imaginative planning was to find “the story”—I considered what inspires me about this book. (Learn more about the “story-form” cognitive tool here on the Tips For Imaginative Educators series). I am most intrigued by the feelings of both despair and hope I feel in the book. As the trees and animals begin to decrease, captured beautifully by Base’s illustrations, the pollution and overcrowding increase. (A dramatic tension—or “Binary opposition” of emotional ideas–is another cognitive tool of Imaginative Education.)
I feel real despair when eventually there are no animals, no plants, and no people in the garden. The humans destroy the garden, leaving a polluted wasteland in place of the beautiful oasis. On the other hand, I feel hopeful when Uno’s grandchildren begin to replenish the garden keeping the buildings environmentally friendly and in balance with the surroundings. In my teaching using this story, I aim to have students experience this powerful emotional pull between hope and despair.
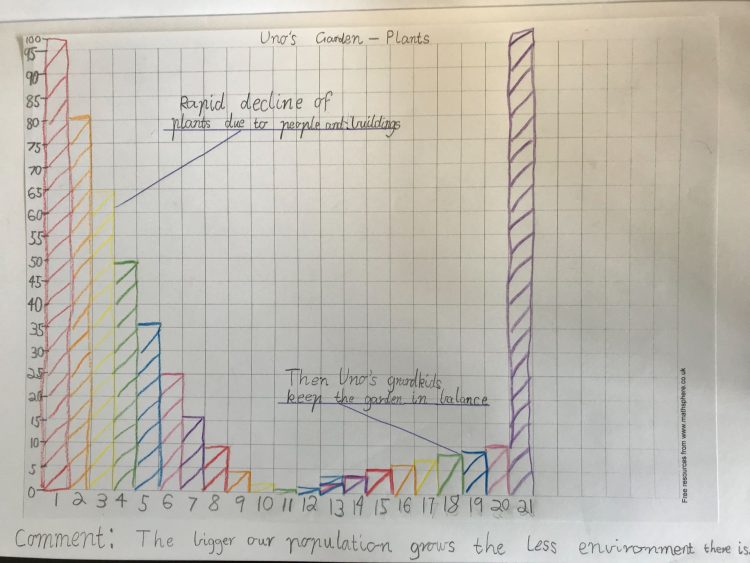
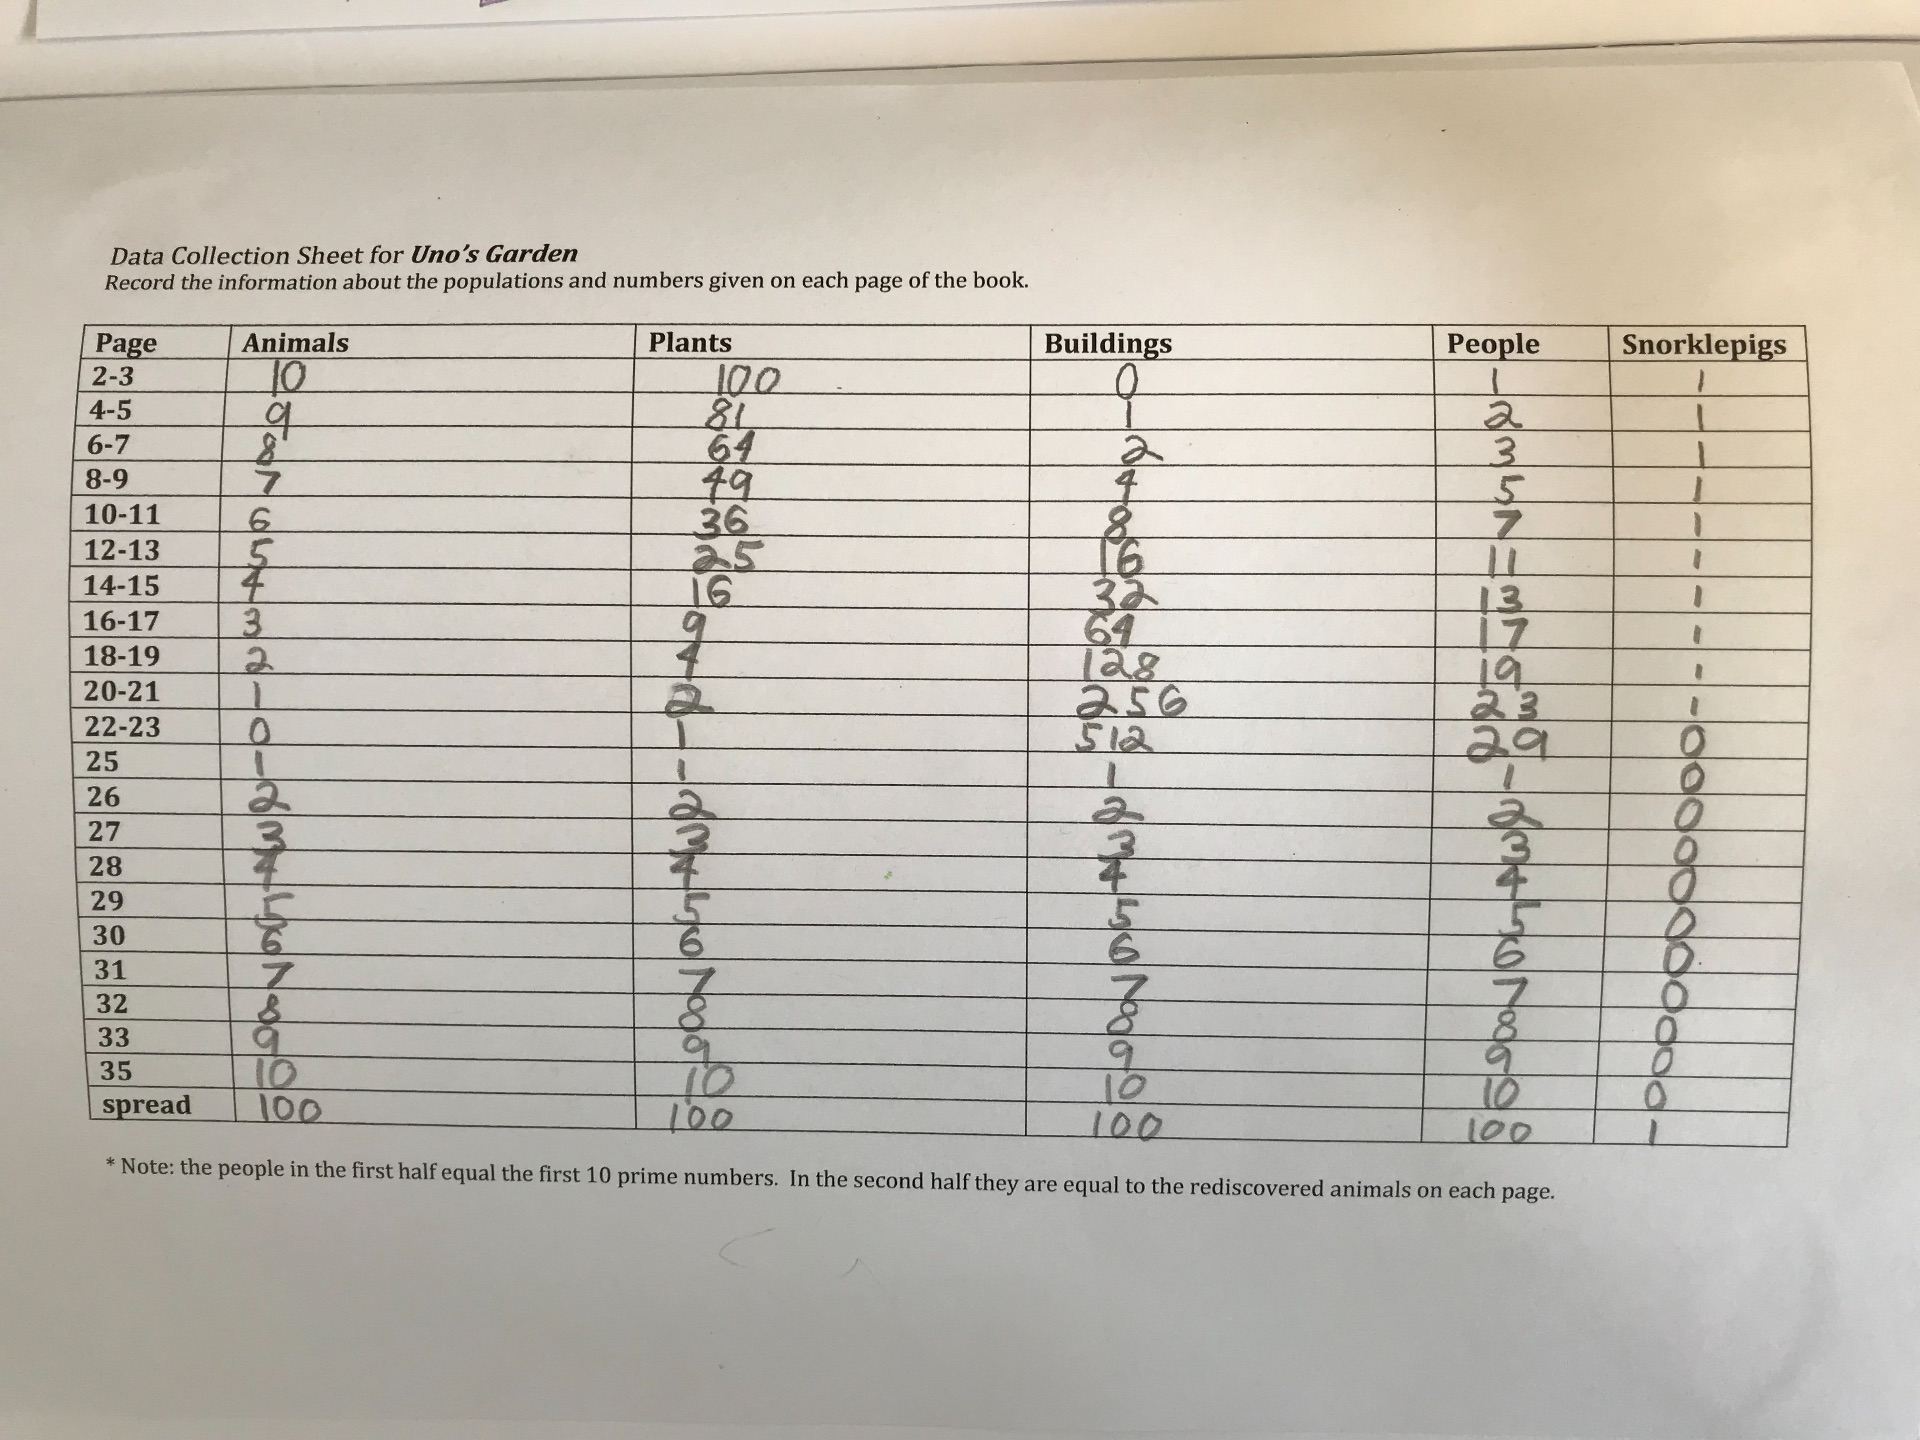
The second feature of this story that engages me is the use/presentation of the data. I love how Base uses different number patterns. For example on each page:
- the animals decrease by 1 (10, 9, 8, 7…)
- the plants decrease in the square numbers pattern (10×10, 9×9…)
- the buildings double (2,4,8,16…)
- the amount of people increase by the prime numbers (1,3,5,7,11…)
The variety of counting patterns reveals the versatility of math. (Heroic quality! Yet another cognitive tool to engage my students.) My students play with the different counting patterns when collecting the data and graphing. The variety in the book easily allows me to differentiate the activity for students in my class. For example, students ready to extend their learning graph the decrease in plants, whilst the students needing support graph the linear decrease in animals.
In my teaching, I focused on my students’ emotional responses to the story–we discussed how they felt as they saw the environmental damage happen and subsequent revival of life in the garden. Some of the feelings my students shared included sadness, despair and disappointment followed by hope, happiness and harmony. On reflection I feel it was very important for them to notice and feel this dramatic opposition as it helped them to more easily explain their graphs.

When it came to graphing the data, after reading the story I was truly surprised and inspired at the engagement of my students and their ability to discuss the story behind their graphs. In particular one of my less eager learners was so proud of his graph that he wanted to finish it at home. It also warmed my heart to see another of my less eager learners proudly explaining his graph to his classmates. He was using the imaginative tool of the story to explain his graph!
Drawing out my students’ emotional responses to the story combined with explicit teaching of graphing created an engaging learning sequence for all.
If teaching from this book again, I would additionally focus on how the book is a metaphor for actual real life human environmental degradation. I would need to find an excellent real life conservation example.
Have any readers got any thoughts of a real life story that would fit?
